
Stats Dashboard
The reproduction or publication of any figures or statistics on this page is strictly prohibited.
Footfall data source: MRI OnLocation (Footfall Analytics)
Weekly footfall for w/c 02/11/2026
Headlines
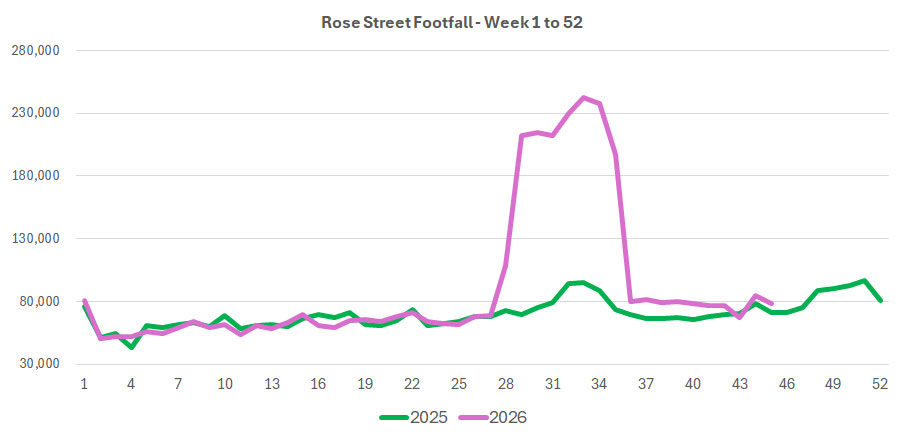
The total number of visitors to Edinburgh City Centre for the last 52 weeks is up 10.6% on the previous year, with the total number of visitors for the year to date up 11.2% on the previous year.
The busiest day of the week commencing 2 November was Saturday 7 November, the peak hour of the week was 5pm on Saturday 7 November.

Monthly Footfall: October 2026
Headlines
53% of city centre pedestrian traffic was travelling eastbound in October.
The busiest day of the month was Saturday 31 October with the peak hour of the month at 4pm on that Saturday.
Retail & Hospitality Sales for September 2026
Year-on-year
2026 Footfall: Quarter 3
BID Vacancy Monitor
In the summer of 2026 the number of total vacant units within the Essential Edinburgh BID area increased slightly to 42, giving a vacancy rate of 6.3%. There were 16 buildings being redeveloped or refurbished across the area.
The highest proportion of vacancies are retail units at 26, followed by office units at 20 and with 11 vacant hospitality units across the BID. The street with the most vacant units across all sectors is George Street with 18 vacancies.
Vacancy Rate By Street
The vacancy rate for the Essential Edinburgh BID is calculated against the number of levy-paying hereditaments.